Home Health Compare
Daily Activities
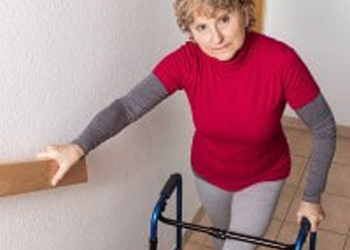
Walking or Moving
How often patients got better at walking or moving around
- Caring Nurses 80.6%
- Nevada Average 75.1%
- National Average 78.2%
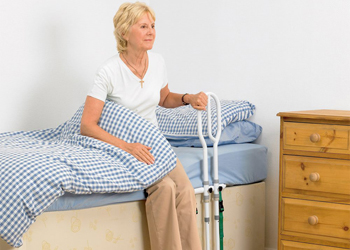
Getting in & out of bed
How often patients got better at getting in and out of bed
- Caring Nurses 79.6%
- Nevada Average 77.6%
- National Average 78.5%
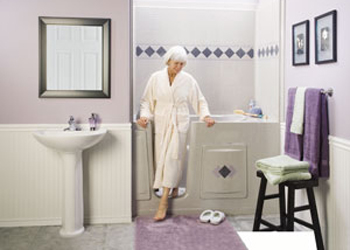
Bathing
How often patients got better at bathing
- Caring Nurses 82.2%
- Nevada Average 79.7%
- National Average 80.3%
Pain and Treating Symptoms
Checked Patients
How often the home health team checked patients for pain
- Caring Nurses 100%
- Nevada Average 98.8%
- National Average 98.8%

Patient’s Pain
How often the home health team treated their patient’s pain
- Caring Nurses 100%
- Nevada Average 99%
- National Average 98.6%

Moving Around
How often patients had less pain when moving around
- Caring Nurses 84.4%
- Nevada Average 78.7%
- National Average 81.4%

Treated Heart Failure
How often the home health team treated heart failure (weakening of the heart) patients’ symptoms
- Caring Nurses 100%
- Nevada Average 98.9%
- National Average 98%

Breathing Improved
How often patients’ breathing improved
- Caring Nurses 74.5%
- Nevada Average 79.4%
- National Average 80.5%
Wounds and Preventing Pressure
After An Operation
How often patients’ wounds improved or healed after an operation
- Caring Nurses 92.9%
- Nevada Average 91.8%
- National Average 91.6%
Pressure Sores
How often the home health team checked patients for the risk of developing pressure sores (bed sores)
- Caring Nurses 100%
- Nevada Average 98.6%
- National Average 98.7%

Bed Sores
How often the home health team included treatments to prevent pressure sores (bed sores) in the plan of care
- Caring Nurses 100%
- Nevada Average 99.2%
- National Average 97.9%

Doctor-Ordered Action
How often the home health team took doctor-ordered action to prevent pressure sores (bed sores)
- Caring Nurses 100%
- Nevada Average 98.2%
- National Average 97%
Harm

Timely Manner
How often the home health team began their patients’ care in a timely manner
- Caring Nurses 98.5%
- Nevada Average 93.9%
- National Average 95.3%

Taught Patients
How often the home health team taught patients (or their family caregivers) about their drugs
- Caring Nurses 99.9%
- Nevada Average 98.3%
- National Average 98.5%
Drugs by Mouth
How often patients got better at taking their drugs correctly
by mouth
- Caring Nurses 75.7%
- Nevada Average 70.5%
- National Average 70.7%
Risk of Falling
How often the home health team checked patients’ risk of falling
- Caring Nurses 99.8%
- Nevada Average 99.6%
- National Average 99.6%

Depression
How often the home health team checked patients for depression
- Caring Nurses 99.9%
- Nevada Average 98.0%
- National Average 97.5%

Pneumonia Shot
How often the home health team made sure that their patients have received a pneumococcal vaccine (pneumonia shot)
- Caring Nurses 79.7%
- Nevada Average 74.6%
- National Average 81.9%
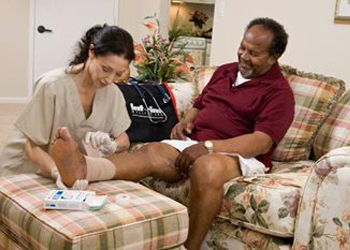
Foot Care
For patients with diabetes, how often the home health team got doctor’s orders, gave foot care, and taught patients about foot care
- Caring Nurses 99.8%
- Nevada Average 98.0%
- National Average 97.6%
Flu Shot
How often the home health team made sure that their patients have received a flu shot for the current flu season
- Caring Nurses 70.6%
- Nevada Average 70.7%
- National Average 78.9%